Menu
W. R. Berkley Corporation 2019 Annual Report
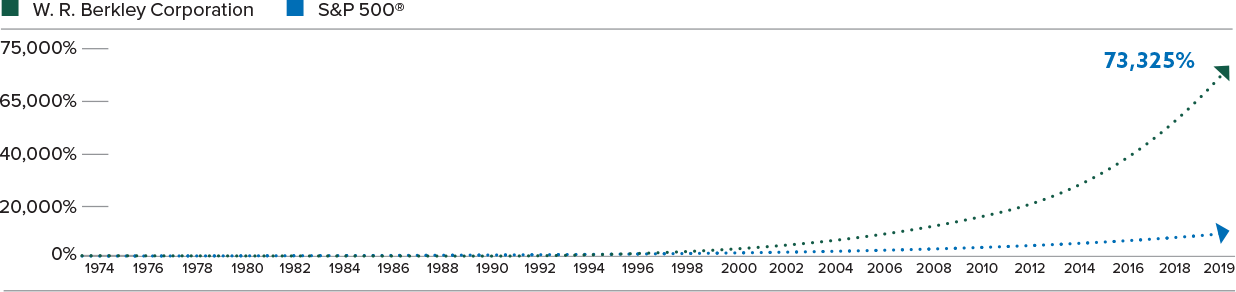
W. R. Berkley Corporation’s
Performance vs. the S&P 500®
Notes: W. R. Berkley Corporation’s book value per share has been adjusted for stock dividends paid from 1975 to 1983. Stock dividends were 6% in each year from 1975 to 1978, 14% in 1979, and 7% in each year from 1980 to 1983. The Company has paid cash dividends each year since 1976.
click here to view data. minimize
w. r. berkley corporation’s performance vs. the S&P 500®
Annual Percentage Change
| In Per-Share Book Value of W. R. Berkley Corporation with Dividends Included | In S&P 500® with Dividends Included | Relative Results | |
|---|---|---|---|
| Year | (1) | (2) | (1)-(2) |
| 1974 | 50.0% | -26.4% | 76.4% |
| 1975 | 12.5% | 37.2% | -24.7% |
| 1976 | 29.6% | 23.6% | 6.0% |
| 1977 | 28.6% | -7.4% | 36.0% |
| 1978 | 24.4% | 6.4% | 18.0% |
| 1979 | 18.2% | 18.2% | 0.0% |
| 1980 | 9.4% | 32.3% | -22.9% |
| 1981 | 14.5% | -5.0% | 19.5% |
| 1982 | -9.0% | 21.4% | -30.4% |
| 1983 | -11.6% | 22.4% | -34.0% |
| 1984 | -16.9% | 6.1% | -23.0% |
| 1985 | 59.6% | 31.6% | 28.0% |
| 1986 | 106.8% | 18.6% | 88.2% |
| 1987 | 23.5% | 5.1% | 18.4% |
| 1988 | 22.5% | 16.6% | 5.9% |
| 1989 | 13.2% | 31.7% | -18.5% |
| 1990 | 7.8% | -3.1% | 10.9% |
| 1991 | 20.8% | 30.5% | -9.7% |
| 1992 | 13.5% | 7.6% | 5.9% |
| 1993 | 16.7% | 10.1% | 6.6% |
| 1994 | -10.8% | 1.3% | -12.1% |
| 1995 | 34.5% | 37.6% | -3.1% |
| 1996 | 7.9% | 23.0% | -15.1% |
| 1997 | 15.9% | 33.4% | -17.5% |
| 1998 | 1.9% | 28.6% | -26.7% |
| 1999 | -18.1% | 21.0% | -39.1% |
| 2000 | 17.1% | -9.1% | 26.2% |
| 2001 | 7.6% | -11.9% | 19.5% |
| 2002 | 31.2% | -22.1% | 53.3% |
| 2003 | 26.7% | 28.7% | -2.0% |
| 2004 | 25.6% | 10.9% | 14.7% |
| 2005 | 21.9% | 4.9% | 17.0% |
| 2006 | 30.1% | 15.8% | 14.3% |
| 2007 | 16.3% | 5.5% | 10.8% |
| 2008 | -4.1% | -37.0% | 32.9% |
| 2009 | 23.3% | 26.5% | -3.2% |
| 2010 | 15.4% | 15.1% | 0.3% |
| 2011 | 12.2% | 2.1% | 10.1% |
| 2012 | 14.8% | 16.0% | -1.2% |
| 2013 | 4.8% | 32.4% | -27.6% |
| 2014 | 14.8% | 13.7% | 1.1% |
| 2015 | 4.3% | 1.4% | 3.0% |
| 2016 | 15.7% | 12.0% | 3.7% |
| 2017 | 10.6% | 21.3% | -10.7% |
| 2018 | 4.8% | -4.4% | 9.2% |
| 2019 | 17.7% | 31.5% | -14.4% |
| Average Annual Gain — 1973–2019 | 16.8% | 12.5% | 4.3% |
| Overall Gain — 1973–2019 | 69,998% | 12,454% |